Wherever Isle May Roam
Manhattan on the Move
In 9th grade, I discovered William Rankin’s “The Errant Isle” and loved being able to compare the size of a familiar place to other notable areas, but the static images left me wanting more. Decades later, it inspired me to create an interactive map that can overlay and move any geographic body anywhere. Some examples below of Manhattan Island on the move are inspired by Rankin’s original work.
Try it out!
You can play with it at Borders Without Borders! You might notice instability when zooming (moreso with touch due to unintentional combined drag/zoom) and dealing with geography near poles.
How I got here
I hadn’t used mapping libraries before, so I began by experimenting with GeoJSON layers and masks while playing with Leaflet, MapLibre GL JS, and deck.gl.
I tried to vibe code transformations under the Web Mercator projection, but this looks wrong.
deck.gl and react-map-gl
I tried to make things work with deck.gl, as it seemed the “coolest” and I thought I could utilize MaskExtension for clipping overlays (though unfortunately not in a GlobeView). I overlaid one MapView over another, used custom load resource functions that transformed tiles/GeoJSON based on latitude, and modified the top map style to make portions, like water, transparent so that the lower map was visible through areas where the top style did not draw features.
Before I successfully masked or clipped the top MapView, however, I was already feeling discouraged.
Terrifying tile transformation
At first I naively treated latitude/longitude coordinates as Cartesian coordinates, which led to very wonky/wrong behavior, especially when incorporating trigonometry to handle different bearings between maps because I completely forgot that the ranges for latitude and longitude are not the same, and that lines of latitude vary in length. After several failed attempts at projecting/unprojecting points between different spaces, I still couldn’t correct the vibe-coded tile data transformation under Web Mercator projection, nor validate any AI-produced “improvements.”
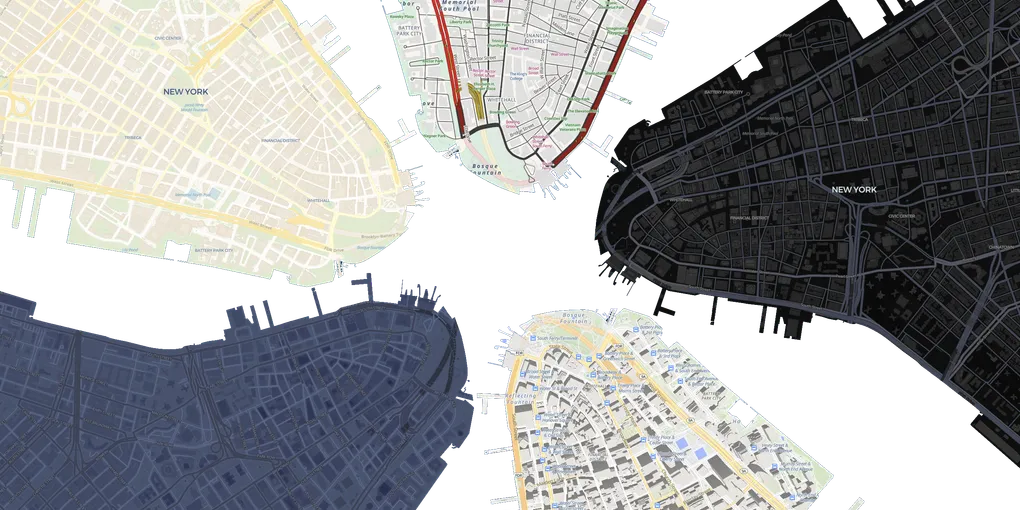
No land’s man
I also temporarily chased basemap-over-basemap rendering and forgot that clipping/masking could avoid that complexity. Whether I added layers to a single MapView or added another MapView over the base one, I needed to make the top map’s water and “background” transparent. Unfortunately, doing so made everything except labels/text transparent because all the free tiles I came across explicitly encoded water polygons, but not land.
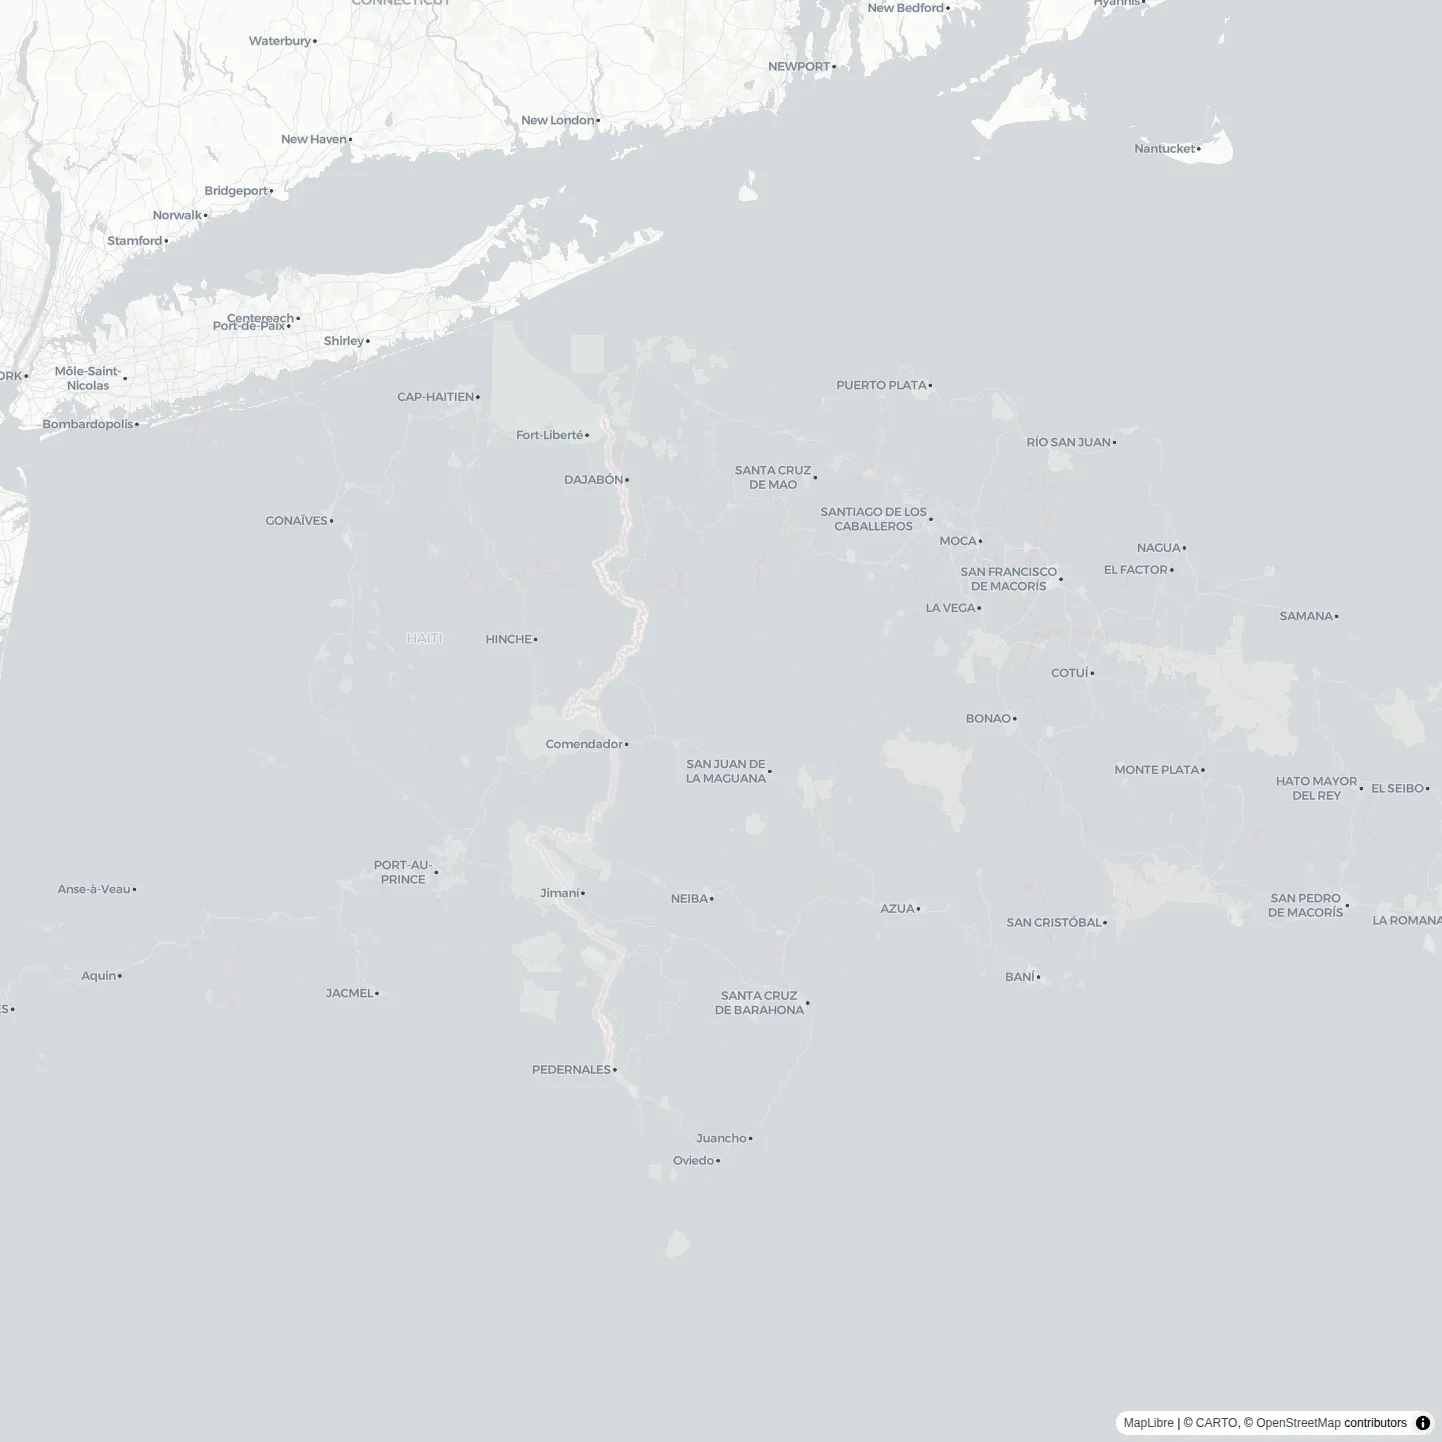
Atlantis rising? No, it’s just Hispaniola arriving with delicious mangoes.
To get land to be opaque without resorting to further complicated tile data hackery, I added a land polygons layer with data from MapTiler, but I disliked the idea of relying on another external service and I still would have had a lot of work to do to get things styled correctly.
Svelte MapLibre GL
I almost gave up, but then I encountered the “scope” implementation in Svelte MapLibre GL’s “Side by Side” example. It overlays one map over another, using a simple CSS clipping mask to selectively display the top map, and I figured the approach would work for the geography clipping I sought. The fact that it would work on a globe excited me because I could theoretically then avoid all the Web Mercator-related troubles I had.
I hacked together a proof of concept, but it was absurdly janky, and abused $effect.
68 collapsed lines
<script lang="ts"> import { center } from "@turf/turf"; import type { Polygon } from "geojson"; import maplibregl from "maplibre-gl"; import { MapLibre, Projection } from "svelte-maplibre-gl";
export interface Layer { baseMapCenter: maplibregl.LngLat; bearing: number; center: maplibregl.LngLat; geojson: Polygon; style?: string | maplibregl.StyleSpecification; zoom?: number; }
export type FirstLayer = Omit<Layer, "baseMapCenter" | "geojson" | "zoom"> & { geojson?: Polygon; zoom: number; };
interface Props { layers: [FirstLayer, ...Layer[]]; style?: string | maplibregl.StyleSpecification; }
let { layers = $bindable(), style = $bindable("https://basemaps.cartocdn.com/gl/voyager-gl-style/style.json"), }: Props = $props();
let maps: (maplibregl.Map | undefined)[] = $state([]);
let width = $state(0); let pixelRatio = $state(1); let prevBaseMapBearing = layers[0].bearing; let elevation: number | undefined = $state(undefined); let pitch = $state(0); let roll: number | undefined = $state(undefined);
$effect(() => { if (layers.length > maps.length) { maps = [...maps, ...Array(layers.length - maps.length).fill(undefined)]; } else if (layers.length < maps.length) { maps.slice(layers.length).forEach((map) => map?.remove()); maps = maps.slice(0, layers.length); } });
let layerSelectedGeometryCenters = $derived( layers.map((layer, index) => maplibregl.LngLat.convert( index === 0 ? layer.center : (center(layer.geojson!).geometry.coordinates as maplibregl.LngLatLike), ), ), );
let layerBaseMapCenterPoints = $derived( layers.slice(1).map((layer) => { if (!maps[0]) { return { x: 0, y: 0 }; } const _ = [layers[0].center, layers[0].zoom, pitch, width, pixelRatio]; return maps[0].project((layer as Layer).baseMapCenter); }), );
$effect(() => { layers.slice(1).forEach((layer, index) => { $effect(() => { layer.zoom = layers[0].zoom - Math.log2( Math.cos((layers[0].center.lat * Math.PI) / 180) / Math.cos((layer.center.lat * Math.PI) / 180), ); });
$effect(() => { layer.bearing += layers[0].bearing - prevBaseMapBearing; });
$effect(() => { const map = maps[index + 1]; if (map) { const selectedGeometryCenterPoint = map.project(layerSelectedGeometryCenters[index + 1]); layer.center = map.unproject([ map._canvas.width / 2 / pixelRatio + (selectedGeometryCenterPoint.x - layerBaseMapCenterPoints[index].x), map._canvas.height / 2 / pixelRatio + (selectedGeometryCenterPoint.y - layerBaseMapCenterPoints[index].y), ]); } }); }); });66 collapsed lines
let clipPaths = $derived<(string | undefined)[]>( layers.map((layer, index) => { const _ = [ layer.center.lat, layer.center.lng, layers[index].zoom, layer.bearing, pitch, width, ]; if (!maps[index] || !layer.geojson) { return undefined; } const pixelPoints = layer.geojson.coordinates[0].map(([lng, lat]) => { const point = maps[index]!.project([lng, lat]); return `${point.x}px ${point.y}px`; }); return `polygon(${pixelPoints.join(", ")})`; }), );
$effect(() => { prevBaseMapBearing = layers[0].bearing; });
export const ro = (node: Element) => { const ro = new ResizeObserver(([entry]) => { width = entry.contentRect.width; pixelRatio = maps[0]?._overridePixelRatio ?? window.devicePixelRatio; }); ro.observe(node); return { destroy: () => ro.disconnect() }; };</script>
<div style="height: 100%; width: 100%;" use:ro role="application"> {#each layers as layer, i (i)} <MapLibre style={layer.style ?? style} inlineStyle={"height: 100%; width: 100%; margin: 0px; padding: 0px; position: absolute; " + (clipPaths[i] ? `clip-path: ${clipPaths[i]};` : undefined)} attributionControl={i === 0 ? undefined : false} bind:center={layer.center} bind:bearing={layer.bearing} bind:map={maps[i]} bind:zoom={ () => layer.zoom, (layerZoom) => (layers[0].zoom = i === 0 ? layerZoom! : layers[0].zoom) } bind:pitch bind:roll bind:elevation minPitch={0} maxPitch={0} scrollZoom={i === 0} onmoveend={(ev) => { if (i !== 0 && ev.originalEvent) { const newSelectedGeometryCenterPoint = maps[i]!.project(layerSelectedGeometryCenters[i]); (layer as Layer).baseMapCenter = maps[0]!.unproject(newSelectedGeometryCenterPoint); } }} > <Projection type="globe" /> </MapLibre> {/each}</div>Disgusting, but it got even worse.
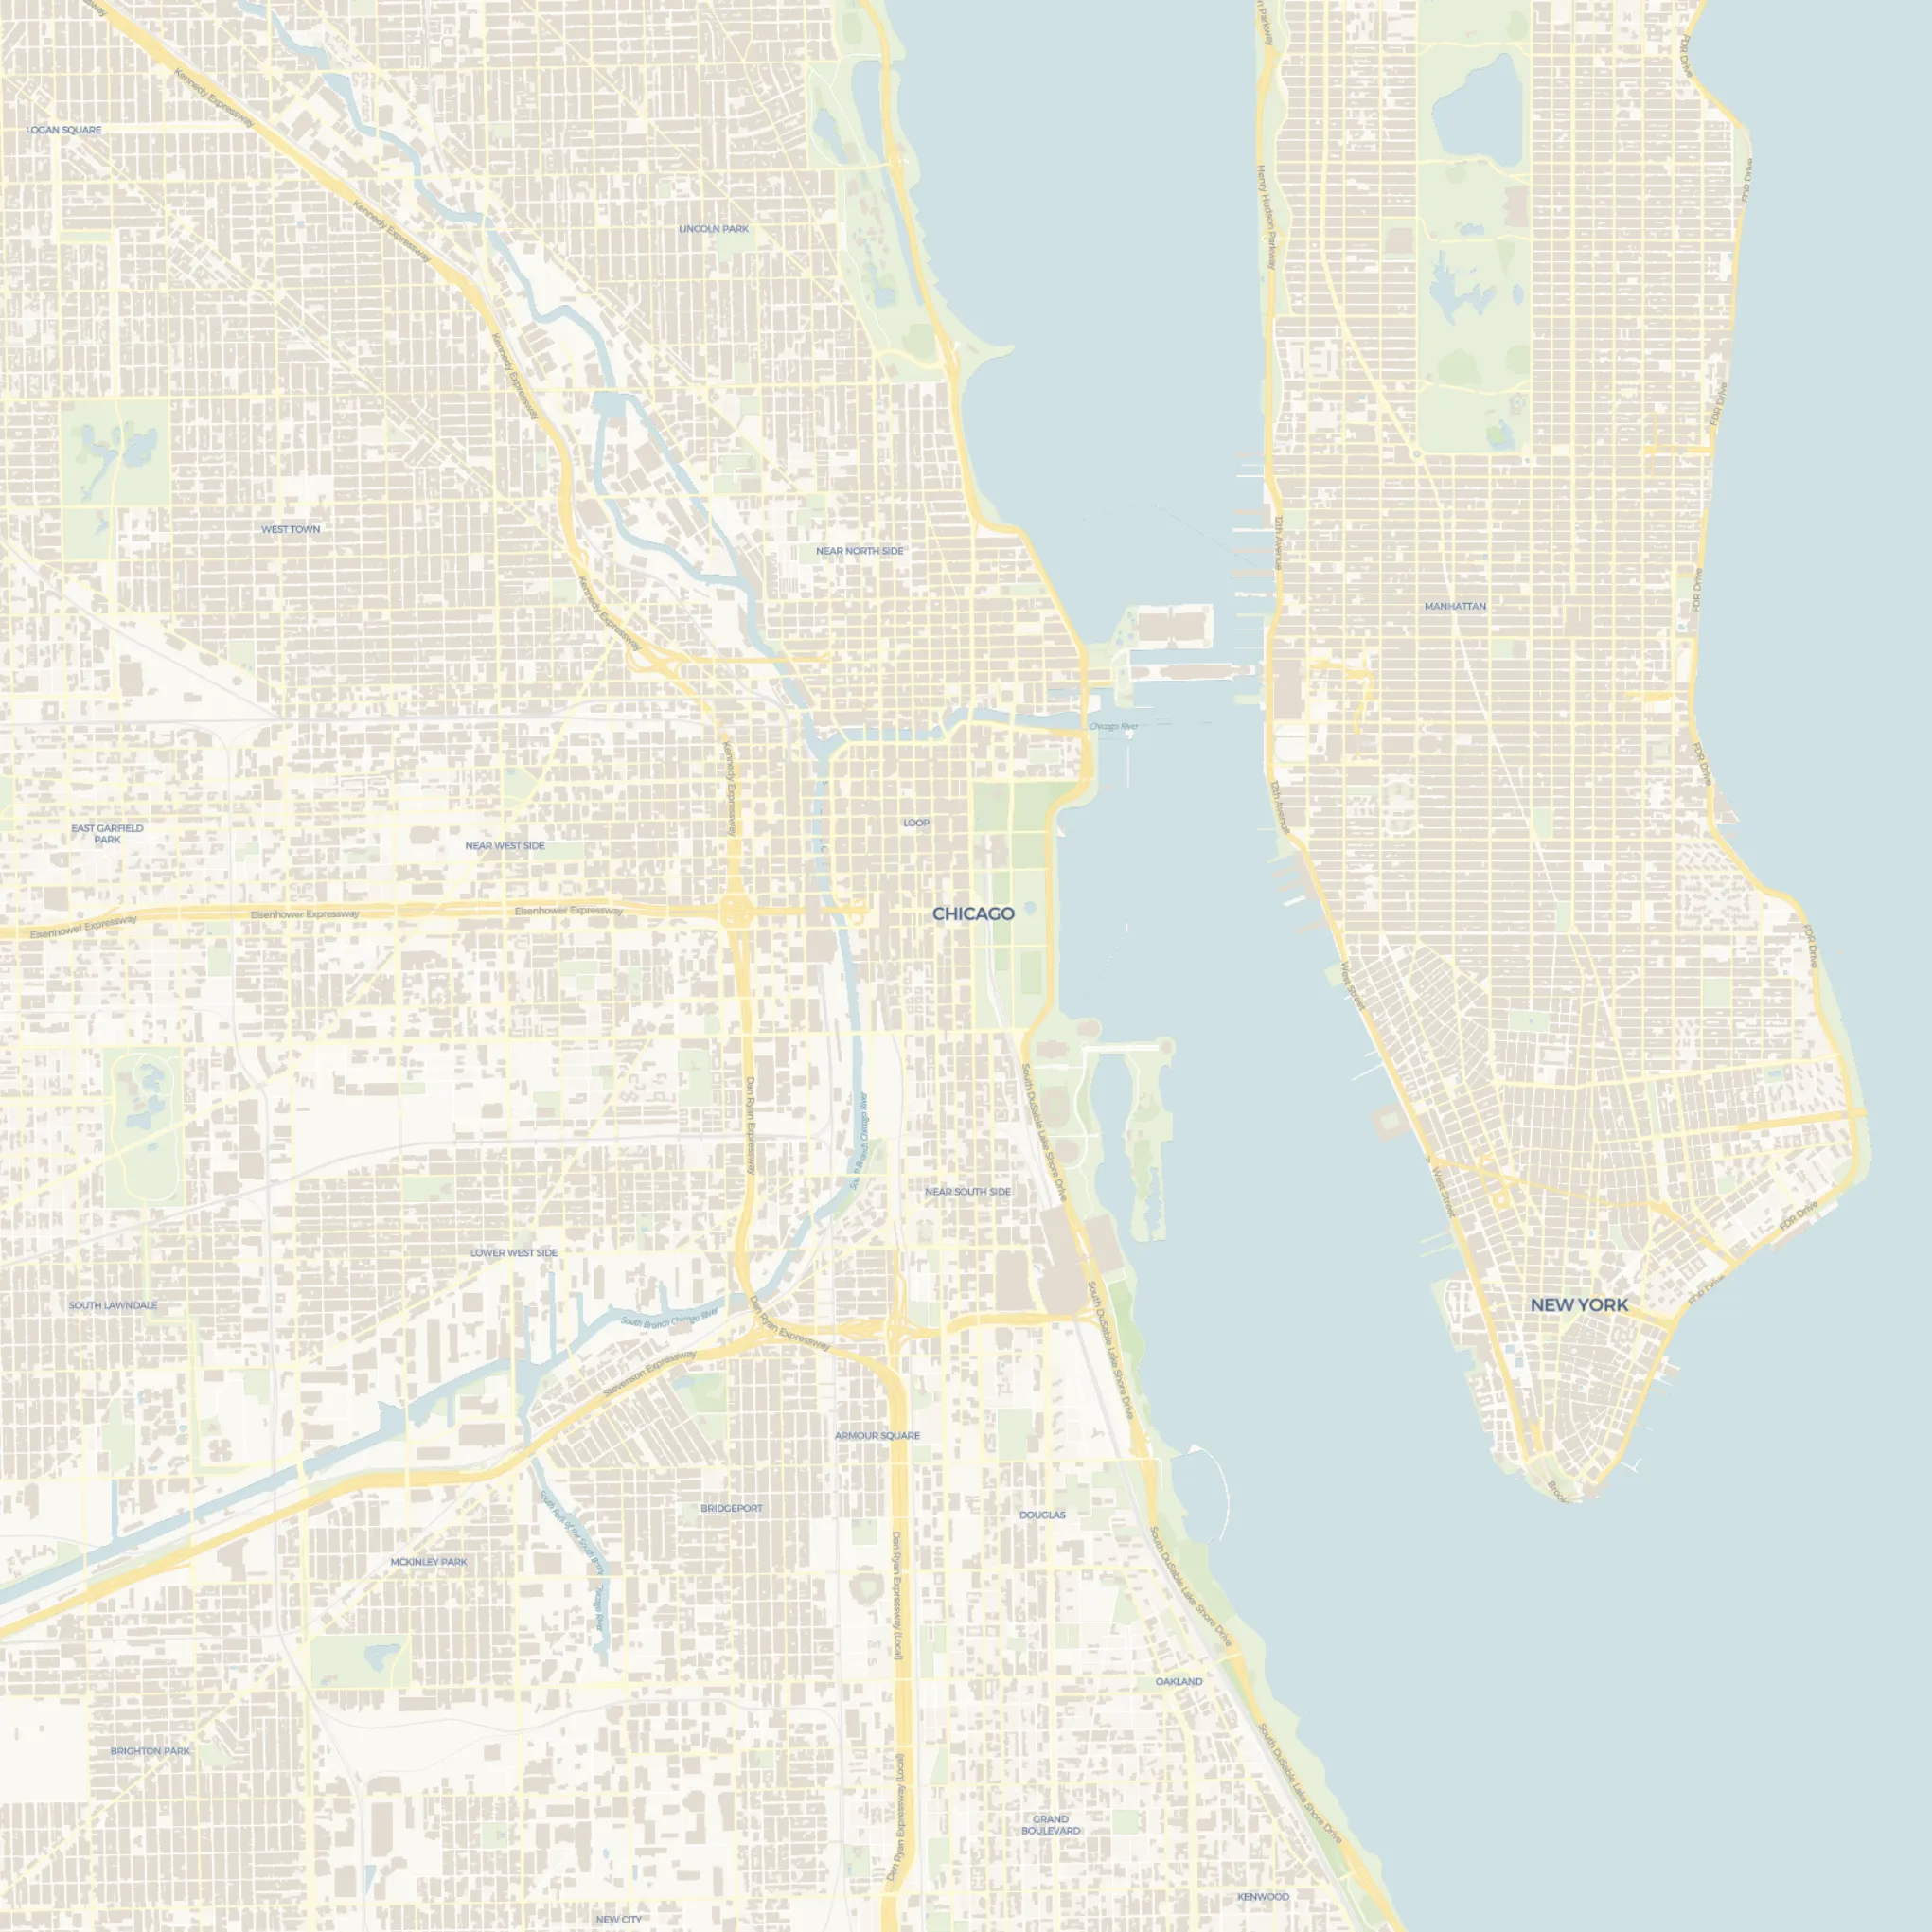
I needed more reasonable ways to synchronize map bearings, centers, and zooms. After much experimentation, I created the following “Fourway Split Map”.
The map in the top left quadrant “controls” the others by pushing drag/rotate interactions to them, but the other 3 maps also maintain their own positions/bearings. Zooming on any quadrant will update the zooms of all quadrants.
50 collapsed lines
<!DOCTYPE html><html lang="en"><head> <title>Zoom and planet size relation on globe</title> <meta property="og:description" content="Explanation of zoom and planet size relation under globe projection and how to account for it when changing the map center and zoom by some delta." /> <meta charset='utf-8'> <meta name="viewport" content="width=device-width, initial-scale=1"> <link rel='stylesheet' href='../../dist/maplibre-gl.css' /> <script src='../../dist/maplibre-gl-dev.js'></script> <style> body { margin: 0; padding: 0; } html, body, #map { height: 99%; } </style></head><body><style> #fly { display: block; position: absolute; top: 20px; left: 50%; transform: translate(-50%); width: 50%; height: 40px; padding: 10px; border: none; border-radius: 3px; font-size: 12px; text-align: center; color: #fff; background: #ee8a65; }</style><div id="map"></div><br /><button id="fly">Go to pole or equator</button><script> const map = new maplibregl.Map({ container: 'map', style: 'https://demotiles.maplibre.org/style.json', center: [0, 0], zoom: 2, });
map.on('style.load', () => { map.setProjection({ type: 'globe', // Set projection to globe }); });
// To stay consistent with web mercator maps, globe is automatically enlarged when map center is nearing the poles. // This keeps the map center visually similar to a mercator map with the same x,y and zoom. // However, sometimes we want to negate this effect and keep the globe size consistent even when changing latitudes. // This function computes what we need to add the the target zoom level when changing latitude. function getZoomAdjustment(oldLatitude, newLatitude) { return Math.log2(Math.cos(newLatitude / 180 * Math.PI) / Math.cos(oldLatitude / 180 * Math.PI)); }27 collapsed lines
// Switch back and forth between zooming in and out. let zoomIn = false; const zoomDelta = 1.5;
document.getElementById('fly').addEventListener('click', () => { // Fly to a random location by offsetting the point -74.50, 40 // by up to 5 degrees. const center = [ map.getCenter().lng, zoomIn ? 0 : 80, ]; const mapZoom = map.getZoom(); const delta = (zoomIn ? zoomDelta : -zoomDelta); // We want to change the map's globe size by some delta and change the center latitude at the same time, // thus we need to compensate for the globe enlarging effect described earlier. const zoom = map.getZoom() + delta + getZoomAdjustment(map.getCenter().lat, center[1]); map.flyTo({ center, zoom, essential: true // this animation is considered essential with respect to prefers-reduced-motion }); zoomIn = !zoomIn; });</script></body></html>Synchronizing zoom levels between maps was daunting until I conveniently encountered this snippet in an example.
I ported the relevant logic from the Fourway Split Map into a more flexible multi-layer map state class used by the Map component demonstrated near the top of this post. I added hacky synchronization logic to ensure overlays are anchored to basemap locations and Svelte reactivity is both utilized and kept at bay.
Potential improvement
I would love to figure out how to transform (and maybe even merge) tile data quickly to avoid overlaying maps and relying on CSS clipping, which interferes with label and 3D feature rendering at overlay edges. In addition to looking nicer and being more robust, using a single map with custom tiles would allow switching between globe and Web Mercator projections, offering an open-source TrueSize.net experience, but with normal tile rendering and support for more geographies.